Binomial and Chi-Squared Tests
Using SPSS for Nominal Data:
Binomial and Chi-Squared Tests
![]()
This tutorial will show you how to use SPSS version 12.0 to perform binomial tests, Chi-squared test with one variable, and Chi-squared test of independence of categorical variables on nominally scaled data.
This tutorial assumes that you have:
Binomial Test
The binomial test is useful for determining if the proportion of people in one of two categories is different from a specified amount. For example, if we asked people to select one of two pets, either a cat or a dog, we could determine if the proportion of people who selected a cat is different from .5. (That is, is the proportion of people who selected a cat different from the proportion of people who selected a dog.)
SPSS assumes that the variable that specifies the category is numeric. In the sample data set, the PET variable corresponds to the question described above, but it is a string variable. So we will have to recode the variable before we can perform the binomial test. If you don't remember how to automatically recode a variable, see the tutorial on transforming variables. I automatically recoded the PET variable into a variable called PETNUM.
As always, we will perform the basic steps in hypothesis testing:
First, scroll in the SPSS Data Editor until you can see the first row of the variable
that you just recoded. If you do not already have View | Value Labels turned on, do so
(if there is a check next to Value Labels when you pull down the View menu, the labels
are turned on, otherwise you should click on Value Labels to turn it on.) Look at the
first observation for the recoded variable:
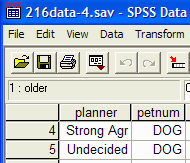
In the sample data set, the first value corresponds to a person who would select a dog as a pet. Make a note of this value as we will need it later.
To perform the binomial test, select Analyze | Nonparametric Tests | Binomial:
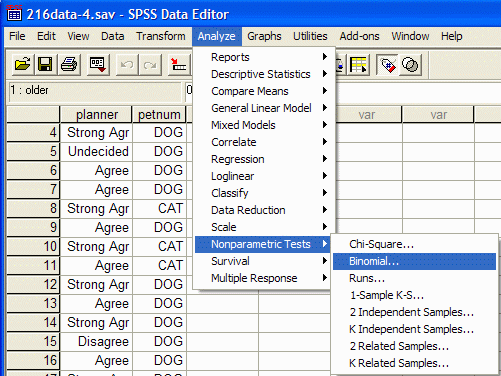
The Binomial dialog box appears:
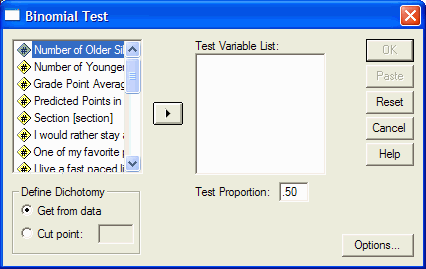
Select the variable of interest from the list at the left by clicking on it, and then
move it into the Test Variable List by clicking on the arrow button. In this example, I
selected the variable that I automatically recoded previously (PETNUM) and moved it into
the Test Variable List box:
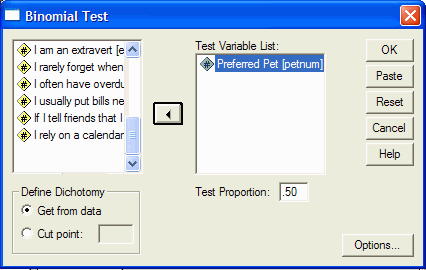
If the value of the first observation (determined above) is the same as the value in your hypothesis, then you should enter the hypothesis proportion into the Test Proportion box (if it does not already contain it.) In this example, the first observation is DOG, and the hypothesis is stated in terms of CAT, so we will not perform this step.
If the value of the first observation (DOG in this example) is not the same as the value in your
hypothesis (CAT in this example), then you should enter 1 - the hypothesis proportion into the Test Proportion
box (if it does not already contain it.) (Note: when the
test proportion is .5, it does not matter whether we enter .5 or 1 - .5.) We will enter 1 - .5 = .5:

Click on the OK button to perform the test. The SPSS output viewer appears with the
binomial output:

The output tells us that there are two groups: DOG and CAT. The column labeled N tells us that there were 8 people who reported that they would select a cat and 38 people who reported that they would select a dog. The Observed Prop. column gives the observed proportions (.83 = 38 / (38 + 8)). The next column, Test Prop., gives the value that you entered in the Test Proportion box in the Binomial Test dialog box. The last column, Asymp. Sig. (2-tailed), gives the p value for this statistical test. As always, when the p value is less than or equal to your α level, you can reject H0.
Chi-Squared, One-Variable Test
The chi-squared one-variable test serves a purpose similar to the binomial test, except that it can be used when there are more than two categories to the variable. Thus, if you want to determine if the number of people in each of several categories differ from some predicted values, the chi-squared one-variable test is appropriate. For example, we could test to see the number of people primarily interested in five different areas of psychology is equal. This corresponds to the AREA variable in the sample data set.
SPSS assumes that the variable that specifies the categories is numeric. In the sample data set, the AREA variable corresponds to the question described above, but it is a string variable. So we will have to recode the variable before we can perform the chi-squared test. If you don't remember how to automatically recode a variable, see the tutorial on transforming variables. I automatically recoded the AREA variable into a variable called AREANUM.
Perform the basic steps in hypothesis testing:
To perform the chi-squared, one-variable test, select Analyze | Nonparametric |
Chi-Square:
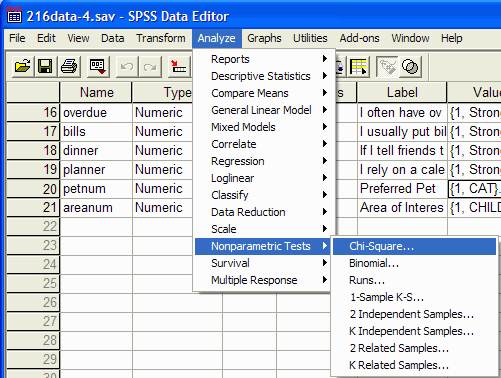
The Chi-Squared Test dialog box appears:
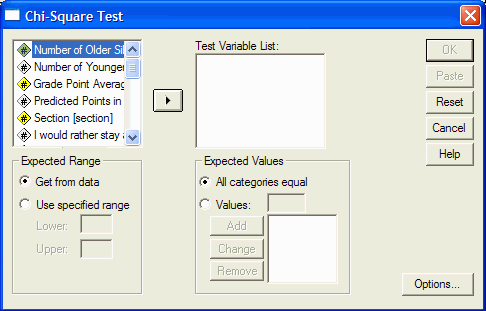
Select the variable of interest from the left hand box and move it into the Test
Variable List by clicking on the arrow key. In this example, I will select the AREANUM
variable (that I recoded from the AREA variable using Transform | Automatic Recode) and
move it into the Test Variable List:
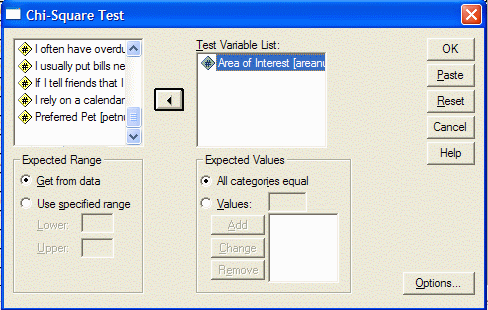
If, as in this example, your hypothesis is that all the frequencies are equal, you can click on the OK button to perform the chi-squared test. Otherwise, you must tell SPSS what the expected frequencies are for each category. To specify the expected frequencies, click on the Values radio button in the Expected Values frame. Type the expected value for the category that corresponds to a value of 1 and click the Add button. Type the expected value for the category that corresponds to a value of 2 and click the Add button. Repeat until you have entered the expected value for each category. You must enter the expected values in the same order as the conditions are numbered (e.g. Child is entered first, clinical is entered second, etc. You can turn View | Value Labels on and off to see which value corresponds to which label. Or you can look at the SPSS output from the automatic recode.) Then click on the OK button.
The output appears in the SPSS output viewer:
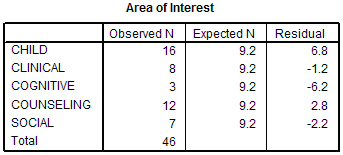
The first part of the output gives the categories in the first column, the observed
frequencies of the categories in the second column, the expected frequencies of the
categories in the third column, and the residual (the difference of the observed and
expected frequencies) in the fourth column. For example, 16 people reported that they
were primarily interested in child psychology, 9.2 people were expected to be
primarily interested in child psychology if the proportions across the categories were
equal, and the difference between the observed (16) and expected (9.2) is 6.8.
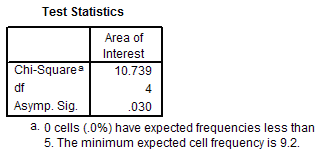
The second part of the output gives the value of the chi-square statistic (10.739 in this example), the degrees of freedom (df) (4 in this example), and the p value is given on the last line of the output. In this example, the p value is .030. Under the table are important statements about the assumptions of chi-square. In this example, none of the cells (categories) have expected frequencies less than 5. Thus, the assumption has been satisfied.
Chi-Squared Test of Independence of Categorical Variables
The chi-squared test of independence of categorical variables is used to answer the question of whether the effects of one variable depend on the value of another variable. For example, we could ask if the area of psychology that a person prefers depends on whether they would select a cat or a dog as a pet. (This isn't as odd as it seems. Some areas of psychology tend to be more male dominated while other areas tend to be more female dominated. There also is a difference in which pet males and females prefer.)
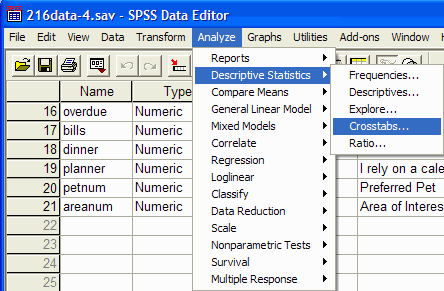
To perform the chi-squared test of independence of categorical variables, select
Analyze | Descriptive Statistics | Crosstabs:
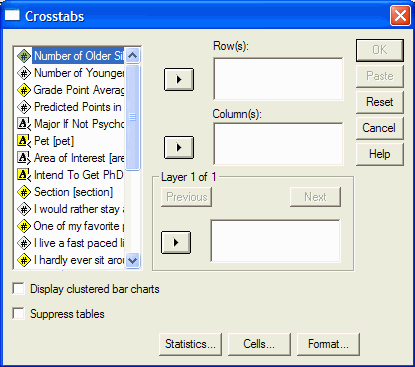
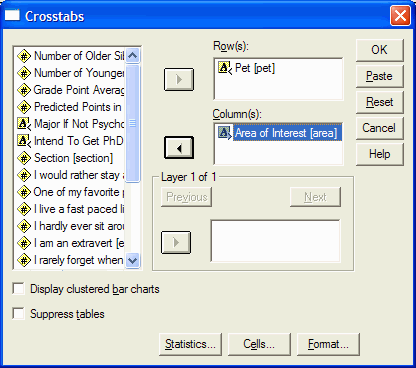
The Crosstabs dialog box appears:
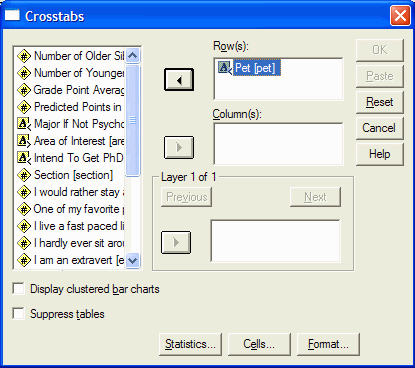
Select one of the variables of interest from the list at the left and move it into the
Row(s) box by clicking on the upper arrow button. In this example, I will move the PET
variable into the Row(s) box:
Select the other variable of interest from the list at the left and move it into the
Column(s) box by clicking on the middle arrow button. In this example, I will move the
AREA variable into the Column(s) box:
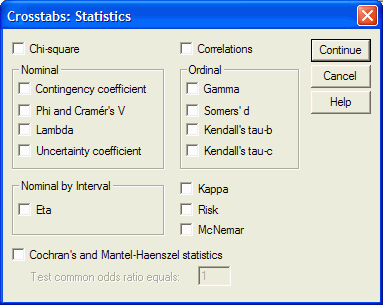
Click on the Statistics button. The Crosstabs: Statistics dialog box appears:
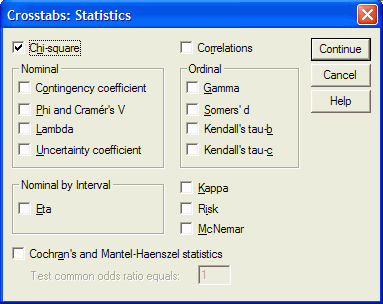
Click in the check box next to the Chi-square option:
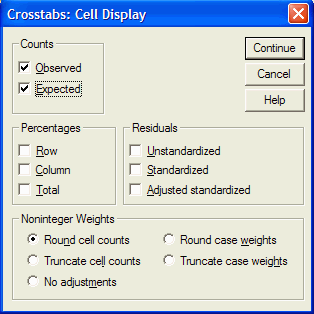
Click on the Continue button to return to the Crosstabs dialog box. Click on the Cells
button. The Crosstabs: Cell Display dialog box appears:
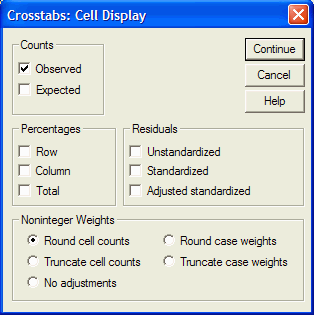
To display the expected frequencies, click in the check box next to Expected in the
Counts frame:
Click on the Continue button to return to the Crosstabs dialog box. Click on the OK
button to perform the chi-squared test of independence of categorical variables. The
SPSS output viewer appears:

The first part of the output simply gives information about the sample size. In this
example, 46 people responded to both the area of interest and pet questions. No people
failed to respond to at least one of the two questions.

The second part of the output gives the chi-square table of observed and expected
frequencies for each possible combination of the two variables. In this example,
2 person
reported that they were primarily interested in Child psychology and would select a cat
as a pet (from the Count row of the CAT row and CHILD column.) The expected frequency
for this cell under H0 is 2.8 (from the Expected Count row of the CAT row
and CHILD column.)
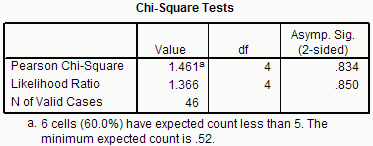
The final section of the output gives the value of the chi-squared test in the first row. The value of the chi-squared statistic is 1.461. The chi-squared statistic has 4 degrees of freedom (from the df column.) The last column gives the two-tailed p value associated with the chi-squared value. In this case, the p value equals .834. In this example, there is an important warning at the bottom of the Chi-Square output. The warning tells us that 60% of the cell have expected frequencies less than 5. Thus, one of the assumptions of chi-square has been violated and the results may not be meaningful.