z Score Definition of r
![]()
Note: This demonstration assumes that you are using Microsoft's Internet Explorer as your browser. You can download it for free from http://www.microsoft.com/ie/download/windows.htm. It also assumes that you are using Windows 95, 98 or NT. When asked if you want to install the control, click on Yes.
This demonstration deals with the z score definition of Pearson's product moment correlation
coefficient:
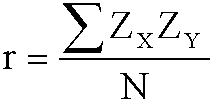
This formula is based on the fact that the z scores transform the scale of the X and Y distributions so that both have a mean of zero and a standard deviation of 1. This allows us to more easily compare X scores to Y scores.
In a perfect, positive correlation, the largest X score is paired with the largest Y score. (If the largest X score was paired with some other Y score, we would not be able to predict the Y score given the X score.) Likewise, the second largest X score is paired with the second largest Y score, and so on. By transforming the X and Y scores to Z scores, we make the largest ZX score identical to the largest ZY score. This is true for all the other pairs of scores. In other words, when there is a perfect, positive correlation ZX = ZY. If we then substitute ZX for ZY in the equation for the definition of r, we get that r equals the mean of the squared Z scores. But the sum of the squared Z scores always equals N, so r equals N divided by N or 1.
When two sets of scores have no relation, then knowing the value of X tells us nothing about the value of Y. That is, for any given value of X, the value of Y could be larger than X, smaller than X, or equal to X. The same is true for the Z scores of X and Y. When ZX is larger than the mean of X (i.e. ZX is positive), ZY is as likely to larger than the mean of Y (i.e. ZY is positive) as ZY is to be smaller than the mean of Y (i.e. ZY is negative.) Thus, the product of ZX and ZY is as likely to be positive as it is to be negative. In general, the positive ZX times ZYs will tend to cancel out the negative ZX times ZYs and the sum will tend toward 0, making r = 0.
You can enter 10 pairs of X and Y values into the control. When there are at least two X scores and two Y scores, the Z scores for X and Y will be displayed. (Why can't the Z scores be displayed when there is only one X score or one Y score?) Watch the mean of the product of the Z scores -- this is the correlation coefficient. Try entering X and Y scores that are perfectly correlated (e.g. (1, 2), (2, 4), (3, 6), etc.) Look at the relation between the ZX and ZY scores. Try entering X and Y scores at random. Look at the relation between the ZX and ZY scores.