SPSS Overview
![]()
This tutorial is an overview of the screen layout in SPSS. A Lotus Screencam file of this tutorial (430 KB) is available. You must have the free Lotus Screen Cam player installed on your computer. This tutorial assumes that you have started SPSS and loaded a data set.
The data window is broken down into a series of columns and rows:
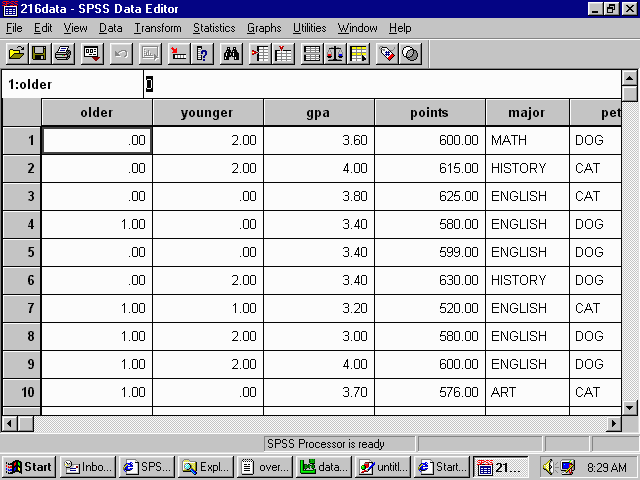
Each column represents the values of a given variable. In this example, several variables
are visible: older, younger, gpa, points, major, and pet. To see additional variables,
use the scrollbar located at the bottom of the window. Each row represents the values
from a given given individual. In this example, we can see data from the first 10
participants. To see the data from additional participants, use the scrollbar located at
the right of the window. In this example, the first participant has a value of 0 for
older (he or she has no older brothers or sisters), a value of 2 for younger (he or she
has two older brothers or sisters), a GPA of 3.60, etc.
Whenever SPSS does calculations, it will display the results in the SPSS Output Viewer
which looks like this:
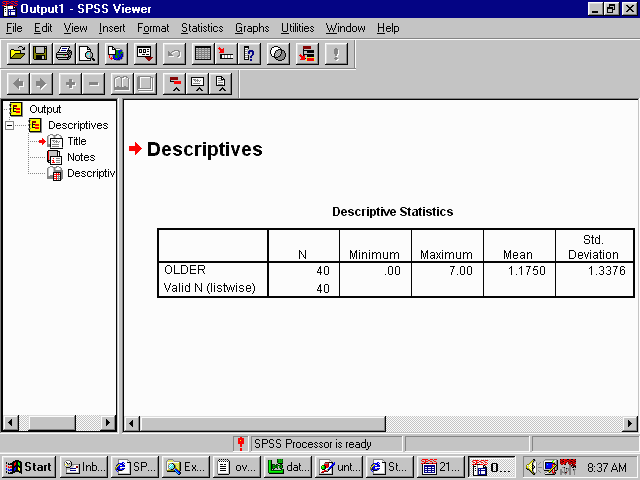
The right hand pane is where you will find all the requested output.
You can return to the data window by clicking on Window | SPSS Data Viewer. To switch back to the output viewer, click on Window | SPSS Viewer.